Howto:IQM Dashboard
The iQM client can also operate as a board client to display graphical real-time information to the agent.
Typically that information’s are displayed on large monitors or with an overhead projector on the wall. Being a client application for the iQM server this call center monitor can even run several times on different PC’s. Here is how.
Applied to
This information applies to
innovaphone PBX version 9 innovaphone Queuemonitor 1.42 innovaphone Queuemonitor client 1.42
The Dashboard software runs like the iQM Agend on a PC with Win7 OS. Operation with older OS will probably work, but is not supported.
More Information
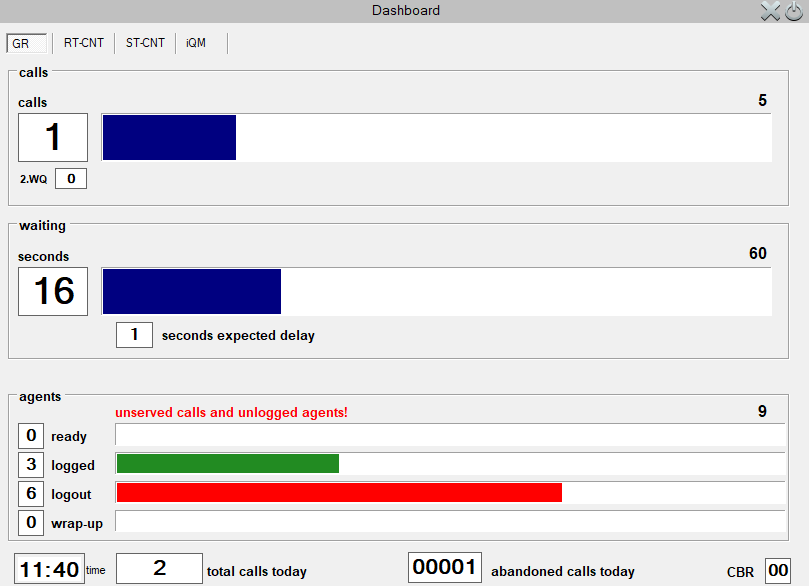
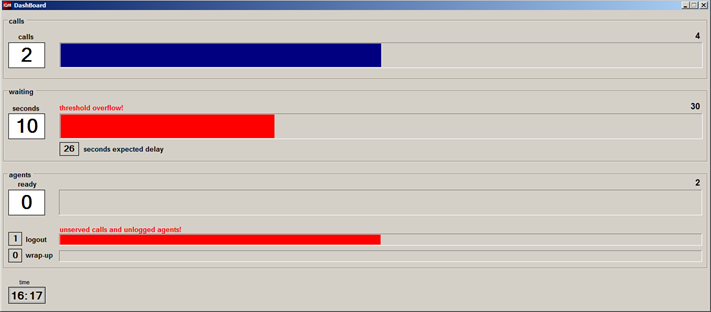
The Dashboard panel is divided in 3 sections: calls, waiting time and agents.
A watch displays the actual time, after start up the time indicates “--:--“ until the connection with the iQM server is up.
If alarm threshold are reached (in the iQM/iQM client the counter is displayed red) a red warning message is displayed and the bar becomes red.
Generally red in the Dashboard means always that something is going bad.
Under the waiting bar the expected delay for the last incoming caller is displayed. This value is based on the average waiting time of the actual hour. If that value is zero the average waiting time of the last month is taken, if even that value is zero “-“ is displayed. The average waiting time is multiplied with the number of caller. In the example there is one caller and 8 seconds expected waiting time displayed, if there are for example 4 caller in the queue, 32 seconds would be displayed; this to give the agents a feeling about the waiting time that a new entry has to face.
The number of caller giving up in the Dashboard view is not displayed, but if that happens a warning message is displayed and the bar will switch to red colour:
The Agent Section shows in the main bar the number of ready agents.
Note: The maximum Number of Agents has not to be configured because it will be loaded from the iQM (and so from the PBX).
Note: “ready” means free and logged, in the example you see that 1 agent is free and another one is logged out.
In the third bar the number of agents in wrap up situation is displayed.
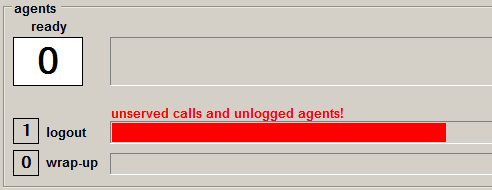
If there are agents logged out and no more agent ready, but calls in the queue the logout bar becomes red and a warning message is displayed:
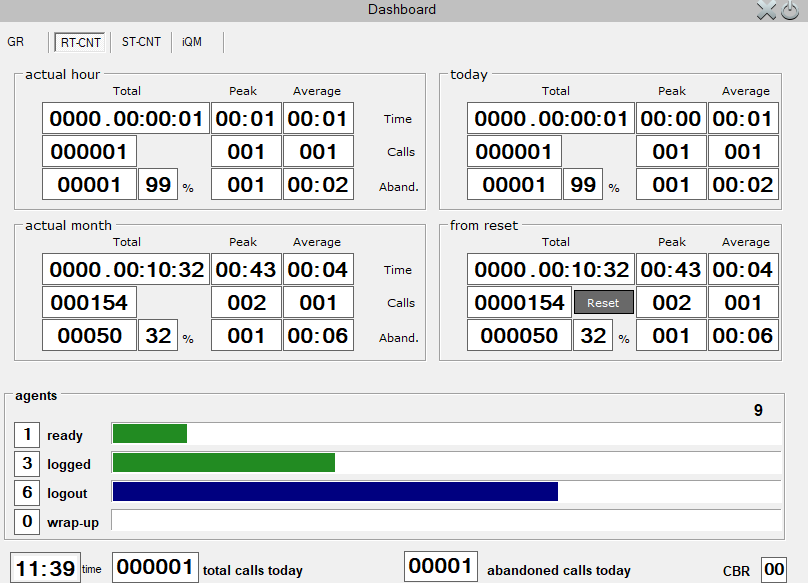
Counters
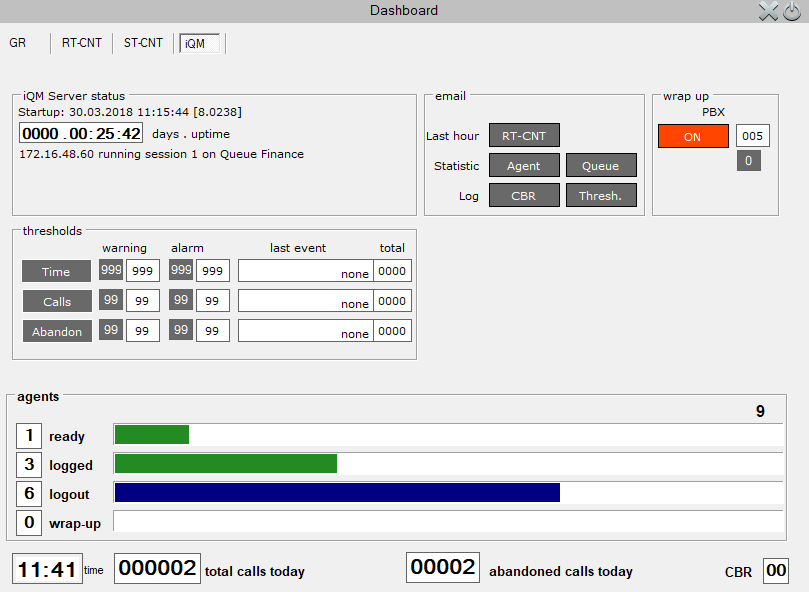
The wallboard can also display the counters of the iQM server. The following picture shows that view, interesting for supervisors.
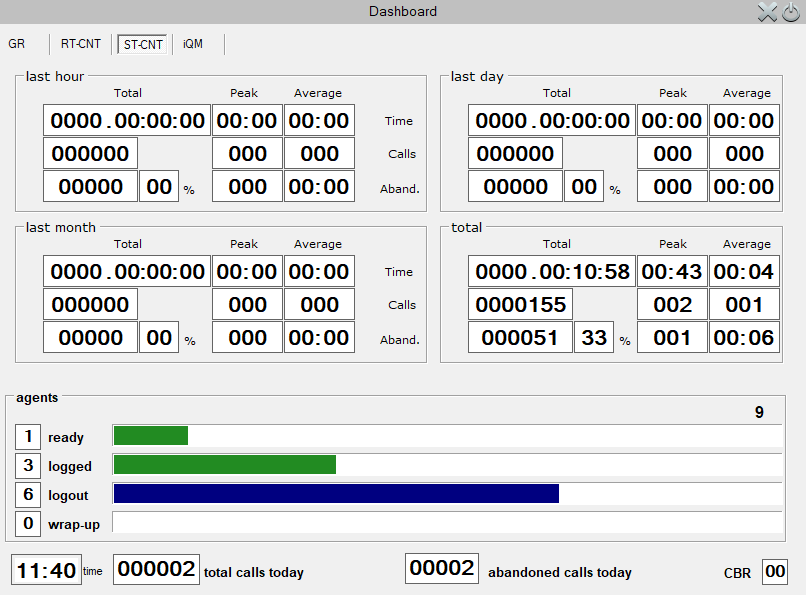
On top in the setup can be enabled the view of the iQM Agent main view contemporary to the wallboard view. In “normal” Wallboard operations the real time counters of the iQM agent view is not visible; but a supervisor would probably also like to display the real time main counters and relative alarms. Also the historical counter can be displayed:
If the iQM Admin falg is active some iQM settings can be done:
Views
The Dashboard has a resolution of 800 x 600 Pixel, this resolution nearly all type of monitors ad overhead projector can handle. If you like to have a full screen view just adapt the video format of your display.
If you display the Dashboard on a 16:9 monitor/TV or similar, you can set the resolution to 1360 x 768 pixel. This option can be switched on in the iQM client setup.
In this mode the Dashboard anyway is displayed on 1360x600 Pixel and so you will have a margin of 168 Pixel in hight.
The Dashboard can be displayed even on extended desktop. Each time you close the call center monitor he will save automatically his position in a file; if started up again the Dashboard will be displayed on the same position.
Statistical Data
A Dashboard is also able to display Queue statistical data (form build 80308). If this option is enabled din the setup a hamburger Button is displayed automatically on the Headline.
See relative online help for further information
Installation and setup
All the setup is done in the iQM client: here you can select the language (in this wiki just the English version is indicated) and define the number of calls and time for the progress bar. The Dashboard is ready for English, German, Italian and French wordings, additional languages can be added easily, se relative chapter in the iQM section.
The dashboard has to be installed like a Queue-Monitor client. No license is required, but a running iQM server.
After the installing the iQM client open the setup section, enter the iQM TCP/IP address and port number and select your language. Flag “Dashboard” in the Dashboard section and define calls and time. Select 1360 Pixel if you use a widescreen, press set. Close the Dashboard and start up again, ready.
WARNING: Note that even if you use the client as a dashboard a unique name is required!
From Build 80082 on even more clients can use the same name if on different IP-address (PC). On top if a customer try to start the agent twice on the same PC a warning message is shown and invite him not to start the second client. Ignore this warning if different users are assigned.
Starting with build 80308, some statistical data can be visualized. In order to switch on this function, the corresponding flag must be set in the configuration on the dashboard. As a result, a button with a Hambuger menu symbol appears in the header. Pressing this button takes you to the statistics visualization and back to the normal dashboard display.
