Reference16r1:Concept App Charts
Applies to
- Charts App
Requirements
- innovaphone PBX
- innovaphone Application Platform 1300xx
- v16r1
Overview
The Charts App allows the centralised display of decentralised data — that is, data provided through the Statistics API and implemented by other apps. In other words, if another application has implemented the Statistics API, it can use this API to make some of its locally stored data available to the Charts App. The Charts App can then request and display that data.
The availability of data in the Charts App is determined by how other App services integrate with and use the API to share their data.
e.g : Connect App can return / create data from its database (like amount of posts, sql queries, etc)
Licensing
Currently no license is required to use the Charts App. But this is subject to change.
Features
- Display data in graph form
- Using different graph types
- Using different time spans
- Using different granularity
- Real time graph
- Save displayed graphs as collections
- For quick access in the future
- Sharing with other users
Installation
With the Settings AP app installer plug-in
Go to the Settings App and open the "AP app installer" plugin. On the right panel, the App Store will be shown. Hint : if you access it for the first time, you will need to accept the "Terms of Use of the innovaphone App Store"
- In the search field located on the top right corner of the store, search for "charts" and click on it
- Select the proper firmware version, here "v16" and click on install
- Tick "I accept the terms of use" and continue by clicking on the install yellow button
- Wait until the install has been finished
- Close and open the Settings App to refresh the list of the available coloured AP plugin
- Click on the "AP Charts" and click on " + Add an App"
- The "Name" display name field (all characters allowed) and the "SIP" administration field (no spaces, no capital letters) need to be filled. You can enter for example Charts/charts.
- Tick the appropriate template to distribute the App
- Click OK to save the settings and a green check mark will be shown to inform you that the configuration is good
Apps
Charts (charts)
This is the standard App within myApps for Charts App. Parameters of the App object:
- Websocket
- Connection between the PBX and the App Platform.
User Interface
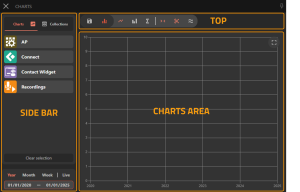
The UI is divided into 3 main parts, which in part are divided into smaller parts:
- Charts Area: Main component displaying the data in chart form.
- Sidebar Area: Used to select the data to be displayed.
- Top Area: Toggles certain display functions.

Charts Area
Here the charts are displayed. The user can hover over data points see the plain number being displayed. Furthermore, when enabled, the component can be scrolled if the displayed timespan is long enough.
Sidebar
The Sidebar has two "modes", "Charts" and "Collections". "Charts" directly displays source apps, categories and charts they provide. "Collections" on the other hand lets the user select saved collections. These in turn are also divided into groups, subgroups and corresponding collections. Below the sidebar is the Timespan /-granularity selector, which lets the user change the corresponding values.
Top
The top mainly houses two components in the toolbar and the legend. The toolbar has toggles for certain functionality like "What chart type should be used" or "Should the chart be compressed to the max visible width". Besides that, it also houses the entry point for the "Save as Collection" functionality. The legend provides the user with an indicator as to what graph is currently displaying what data. And also serves as a toggle for visibility on a graph by graph basis, without having to fully deselect it.
Implemented API in other Apps
Here is a list of the apps that have implemented the Statistics API and the data they return.
Note: This list may change over time.
App Platform Manager
- chart_manager_uptime: Manager uptime
- chart_system_cpu_perc: CPU load
- chart_system_disk_total: Storage size
- chart_system_disk_used: Used storage
- chart_system_memory_total: RAM size
- chart_system_meory_used: Used RAM
Connect
- Posts: Number of posts
- SQL: Number SQL queries
- Sessions: Amount of sessions
Contact Widget
- Chats: Number of text chats
- VoiceCalls: Number of voice calls
- VideoCalls: Number of video calls
- All: Combined chats, voice calls and video calls
Recordings
- CurrentRecordings: Number of currently running recordings
- LicenseType: internal usage, not relevant
- NumRecordings: Number of recordings in the database that have not been deleted
- OldestRecording: Oldest recording in the database not deleted
- ReportingLink: Indicates whether the link between recordings and reports is up or down
- SizeDB: Size of the Database
Libraries used
The following libraries are used to display charts.
- Chart.Js
- License: MIT License
- Further Information: Library
Troubleshooting
When you open a support ticket, you will be asked to provide us with debugging data of your issue. You can also send us screenshots/videos of the behaviour you are reporting. Do not forget to send us also the PBX default configuration file.
Trace flags of the myAPPS Client
Go to the myApps Burger menu, click on more, and then click the magnifying glass. Tick the following trace flag:
- Browser console
- App
Hint: If you are using myApps in a browser, press F12 to open the browser console.
Restrictions / Known issues
- Due to restrictions on the canvas element on iOS the mobile version is limited to a max width of 4096px
