Howto:Analytics - MediaRunway - Partner App: Difference between revisions
Updated text & images for dashboard |
|||
| Line 1: | Line 1: | ||
<!-- replace CompanyLogo by real logo-name. Do not change size & alignment. Upload image by pressing red link --> | <!-- replace CompanyLogo by real logo-name. Do not change size & alignment. Upload image by pressing red link --> | ||
[[Image:Mediarunway_company_logo_200.png | [[Image:Mediarunway_company_logo_200.png|200px|right|/Mediarunway_company_logo_200.png]] | ||
==Product Name== | ==Product Name== | ||
| Line 16: | Line 16: | ||
==Category== | ==Category== | ||
<!-- Do not change this section and do not remove comments. Will be set by innovaphone upon document check --> | <!-- Do not change this section and do not remove comments. Will be set by innovaphone upon document check --> | ||
[[Category: | [[Category:Partner Apps|{{PAGENAME}}]] | ||
{{Category:3rdParty_Reporting_/_Monitoring}} | {{Category:3rdParty_Reporting_/_Monitoring}} | ||
[[Category: | [[Category:3rdParty Reporting / Monitoring|{{PAGENAME}}]] | ||
==Vendor== | ==Vendor== | ||
| Line 24: | Line 24: | ||
<!-- Place optional company logo. Don't change logo size. --> | <!-- Place optional company logo. Don't change logo size. --> | ||
[[Image:Mediarunway_company_logo_150_2.png|150px]] | [[Image:Mediarunway_company_logo_150_2.png|150px|/Mediarunway_company_logo_150_2.png]] | ||
<!-- Give some introducting words about the vendor itself. --> | <!-- Give some introducting words about the vendor itself. --> | ||
| Line 40: | Line 40: | ||
<!-- MR-TODO: Change to icon of the app 100x100 --> | <!-- MR-TODO: Change to icon of the app 100x100 --> | ||
[[Image:mediarunway-analytics.png]] | [[Image:mediarunway-analytics.png|/Mediarunway-analytics.png]] | ||
<!-- Give description about the main product purpose. --> | <!-- Give description about the main product purpose. --> | ||
| Line 67: | Line 67: | ||
=== Users App === | === Users App === | ||
[[Image:analytics_icon_users.png|100px]] | [[Image:analytics_icon_users.png|100px|/Analytics_icon_users.png]] | ||
==== | ==== Menu ==== | ||
[[File:Analytics-user-menu.png|none|thumb|Hamburger Menu]] | |||
==== | ==== Dashboards ==== | ||
[[File:Analytics-user-dashboard-view.png|none|thumb|Example Dashboard]] | |||
[[File:Analytics-user-dashboard-header.png|none|thumb|Header of an Dashboard]] | |||
==== Add | ===== Add Dashboard ===== | ||
* Open Hamburger menu | |||
* | * Click on "+" icon on the right besides "Dashboards" | ||
* Click on | |||
==== | ===== Delete Dashboard ===== | ||
* [[ | |||
* Open Dashboard | |||
* Click on "Delete" in the top right corner | |||
* Confirm | |||
===== Edit Dashbaord ===== | |||
[[File:Analytics-user-dashboard-edit.png|none|thumb|Popup for editing a Dashboard]] | |||
* Open Dashboard | |||
* Click on the Name/Icon in the top left corner | |||
* Enter name | |||
* Pick icon | |||
* Confirm | |||
===== Add Widget ===== | |||
* Open Dashboard | |||
* Click on "New Widget" in the top right corner | |||
* The new widget will be added to the list | |||
* Automatically scrolls to the new widget | |||
===== Delete Widget ===== | |||
* Open Dashboard | |||
* Locate Widget | |||
* Click on "x" in the top right corner of the widget | |||
===== Edit Widget ===== | |||
* Open Dashboard | |||
* Locate Widget | |||
* Click on the Settings icon in the top left corner of the widget | |||
===== Set Widget time span ===== | |||
* Open Dashboard | |||
* Locate Widget | |||
* Click on the Time select in bottom of the widget | |||
===== Widgets ===== | |||
Widgets are the central part of every dashboard.They allow the user to configure a very custom dashboard. | |||
The name of the widget will be visible in the dashboard. | |||
The description is only visible inside this popup. | |||
"Reporting" lets the user select the type of Chart/Query. | |||
====== Reaction time ====== | |||
[[File:Analytics-user-widget-reactiontime.png|none|thumb|Option "Reaction time"]] | |||
* pick one user | |||
====== Call volume ====== | |||
[[File:Analytics-user-widget-callvolume.png|none|thumb|Option "Call volume"]] | |||
* pick multiple users | |||
* filter calls: "internal" / "external" / "internal & external" | |||
* group by: "Count: Incoming & Outgoing" / "Duration: Incoming & Outgoing" / "Count: Accepted & Missed" | |||
====== Utilization ====== | |||
[[File:Analytics-user-widget-utilization.png|none|thumb|Option: "Utilization"]] | |||
* pick one trunk / waiting queue / gateway | |||
* shows the number of parallel calls | |||
====== Calls (Heatmap) ====== | |||
[[File:Analytics-user-widget-heatmap.png|none|thumb|Option "Calls (Heatmap)"]] | |||
* pick multiple users / trunks / waiting queues | |||
* filter calls: "internal" / "external" / "internal & external" | |||
* filter calls: "incoming" / "outgoing" / "incoming & outgoing" | |||
* filter calls: "connected" / "missed" / "busy" / "no channel" | |||
* show: "sum" / "average" | |||
==== Reporting ==== | |||
==== Automation ==== | |||
==== Call Flow ==== | ==== Call Flow ==== | ||
| Line 130: | Line 190: | ||
** Alert time (in seconds) | ** Alert time (in seconds) | ||
*** Enter range for the alert duration of the call (optional) | *** Enter range for the alert duration of the call (optional) | ||
** [[Image:analytics_callflow_filter.png|200px]] | ** [[Image:analytics_callflow_filter.png|200px|/Analytics_callflow_filter.png]] | ||
* Table of Content | * Table of Content | ||
** [[Image:analytics_callflow_toc.png]] | ** [[Image:analytics_callflow_toc.png|/Analytics_callflow_toc.png]] | ||
* Summing Up | * Summing Up | ||
** [[Image:analytics_callflow_summing_up.png|300px]] | ** [[Image:analytics_callflow_summing_up.png|300px|/Analytics_callflow_summing_up.png]] | ||
* Download | * Download | ||
** Available formats: CSV | ** Available formats: CSV | ||
==== Example: Call Flow ==== | ==== Example: Call Flow ==== | ||
* [[Image:analytics_callflow_example.png|800px]] | * [[Image:analytics_callflow_example.png|800px|/Analytics_callflow_example.png]] | ||
==== Send Number (External) ==== | ==== Send Number (External) ==== | ||
| Line 157: | Line 217: | ||
*** 'Anonymize Target' | *** 'Anonymize Target' | ||
*** 'Show Alertduration' | *** 'Show Alertduration' | ||
** [[Image:analytics_sendnumber_filter.png|200px]] | ** [[Image:analytics_sendnumber_filter.png|200px|/Analytics_sendnumber_filter.png]] | ||
* Table of Content | * Table of Content | ||
** [[Image:analytics_sendnumber_toc.png]] | ** [[Image:analytics_sendnumber_toc.png|/Analytics_sendnumber_toc.png]] | ||
* Summing Up | * Summing Up | ||
** [[Image:analytics_sendnumber_summing_up.png|300px]] | ** [[Image:analytics_sendnumber_summing_up.png|300px|/Analytics_sendnumber_summing_up.png]] | ||
* Download | * Download | ||
** Available formats: PDF, CSV | ** Available formats: PDF, CSV | ||
| Line 168: | Line 228: | ||
==== Example: Send Number (External) ==== | ==== Example: Send Number (External) ==== | ||
* [[Image:analytics_sendnumber_external_example.png|800px]] | * [[Image:analytics_sendnumber_external_example.png|800px|/Analytics_sendnumber_external_example.png]] | ||
==== Waiting Queue (Incoming) ==== | ==== Waiting Queue (Incoming) ==== | ||
| Line 174: | Line 234: | ||
==== Example: Waiting Queue (Incoming) ==== | ==== Example: Waiting Queue (Incoming) ==== | ||
* [[Image:analytics_waitingqueue_incoming_example.png|800px]] | * [[Image:analytics_waitingqueue_incoming_example.png|800px|/Analytics_waitingqueue_incoming_example.png]] | ||
==== Waiting Queue (Employees) ==== | ==== Waiting Queue (Employees) ==== | ||
| Line 180: | Line 240: | ||
==== Example: Waiting Queue (Employees) ==== | ==== Example: Waiting Queue (Employees) ==== | ||
* [[Image:analytics_waitingqueue_employees_example.png|800px]] | * [[Image:analytics_waitingqueue_employees_example.png|800px|/Analytics_waitingqueue_employees_example.png]] | ||
==== Automated Reports ==== | ==== Automated Reports ==== | ||
| Line 192: | Line 252: | ||
=== Admin App === | === Admin App === | ||
[[Image:analytics_icon_admin.png|100px]] | [[Image:analytics_icon_admin.png|100px|/Analytics_icon_admin.png]] | ||
==== Configuration ==== | ==== Configuration ==== | ||
| Line 221: | Line 281: | ||
Also only at the Analytics admin pbx app object should be activated the checkboxes like in the next screenshot, no active checkbox in the Analytics user pbx app object! | Also only at the Analytics admin pbx app object should be activated the checkboxes like in the next screenshot, no active checkbox in the Analytics user pbx app object! | ||
[[Image:MediaRunway-Analytics-pbxObjAppConfig.png|400px]] | [[Image:MediaRunway-Analytics-pbxObjAppConfig.png|400px|/MediaRunway-Analytics-pbxObjAppConfig.png]] | ||
==Prerequisites== | ==Prerequisites== | ||
| Line 264: | Line 324: | ||
To collect Data about calls, the CDRs interface needs to be configured. Navigate to Devices App > Devices > 'Pick the PBX to get the CDRs from' > Admin Ui > Gateway > CDR1. The default configuration from CDR0 can be copied. Important is that the path needs to end with 'analytics/cdr'. One way to test the configuration is to do a test call and export the CDRs database in the Analytics Admin App. If its not empty, its very likely that its configured correctly. | To collect Data about calls, the CDRs interface needs to be configured. Navigate to Devices App > Devices > 'Pick the PBX to get the CDRs from' > Admin Ui > Gateway > CDR1. The default configuration from CDR0 can be copied. Important is that the path needs to end with 'analytics/cdr'. One way to test the configuration is to do a test call and export the CDRs database in the Analytics Admin App. If its not empty, its very likely that its configured correctly. | ||
[[Image:analytics_cdr_config.png|700px]] | [[Image:analytics_cdr_config.png|700px|/Analytics_cdr_config.png]] | ||
* the 'Adress' is the uri (without https) of the app platform. | * the 'Adress' is the uri (without https) of the app platform. | ||
* the 'Path' for CDR is the same uri (also without https) which is shown in the 'AP Manager' app at the app instance under 'Webserver path' | * the 'Path' for CDR is the same uri (also without https) which is shown in the 'AP Manager' app at the app instance under 'Webserver path' | ||
| Line 285: | Line 345: | ||
===AP manager settings=== | ===AP manager settings=== | ||
<!-- MR-TODO: Change the picture, adjust px to width of your picture. Replace newappname. --> | <!-- MR-TODO: Change the picture, adjust px to width of your picture. Replace newappname. --> | ||
[[Image:Analytics_ap_manager.png|800px]] | [[Image:Analytics_ap_manager.png|800px|/Analytics_ap_manager.png]] | ||
===PBX manager settings=== | ===PBX manager settings=== | ||
| Line 292: | Line 352: | ||
<!-- MR-TODO: Change the picture, adjust px to width of your picture. Replace newappname. --> | <!-- MR-TODO: Change the picture, adjust px to width of your picture. Replace newappname. --> | ||
[[Image:Analytics_pbx_manager.png|1000px]] | [[Image:Analytics_pbx_manager.png|1000px|/Analytics_pbx_manager.png]] | ||
==Copyright information== | ==Copyright information== | ||
Revision as of 10:40, 22 April 2026
Product Name
MediaRunway Analytics
Certification Status
 This App is listed due to a customer testimonial. No tests have been conducted by innovaphone.
This App has been listed June 2024.
Category
Call Statistics, Call Monitoring Systems
Vendor
![]()
MediaRunway is an ITC enterprise that provides its customers with contemporary IT services in all areas - Your business, our solution.
Description

The Analytics myApps app is the simple, comprehensive and visualized way of evaluating calls to reduce unanswered calls and optimize your business processes. Build and share customized dashboards, take a deeper look into callflows, evaluate your waitingqueues, track the trunk usage or let the system automatically create reports for you. All in one without the needs of an external server.
MediaRunway - About this application
Functions
Users App
![]()
Menu

Dashboards


Add Dashboard
- Open Hamburger menu
- Click on "+" icon on the right besides "Dashboards"
Delete Dashboard
- Open Dashboard
- Click on "Delete" in the top right corner
- Confirm
Edit Dashbaord

- Open Dashboard
- Click on the Name/Icon in the top left corner
- Enter name
- Pick icon
- Confirm
Add Widget
- Open Dashboard
- Click on "New Widget" in the top right corner
- The new widget will be added to the list
- Automatically scrolls to the new widget
Delete Widget
- Open Dashboard
- Locate Widget
- Click on "x" in the top right corner of the widget
Edit Widget
- Open Dashboard
- Locate Widget
- Click on the Settings icon in the top left corner of the widget
Set Widget time span
- Open Dashboard
- Locate Widget
- Click on the Time select in bottom of the widget
Widgets
Widgets are the central part of every dashboard.They allow the user to configure a very custom dashboard.
The name of the widget will be visible in the dashboard.
The description is only visible inside this popup.
"Reporting" lets the user select the type of Chart/Query.
Reaction time

- pick one user
Call volume

- pick multiple users
- filter calls: "internal" / "external" / "internal & external"
- group by: "Count: Incoming & Outgoing" / "Duration: Incoming & Outgoing" / "Count: Accepted & Missed"
Utilization

- pick one trunk / waiting queue / gateway
- shows the number of parallel calls
Calls (Heatmap)

- pick multiple users / trunks / waiting queues
- filter calls: "internal" / "external" / "internal & external"
- filter calls: "incoming" / "outgoing" / "incoming & outgoing"
- filter calls: "connected" / "missed" / "busy" / "no channel"
- show: "sum" / "average"
Reporting
Automation
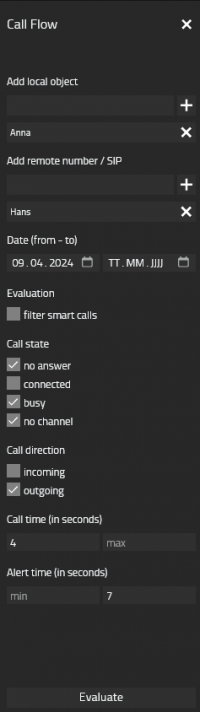
Call Flow
Search for calls, filter after parameters, get an overview in a table and look into the details of a call.
- Filter
- Add local object
- Search after the person in your company
- Add Person by clicking on the '+' Icon
- Remove Person by clicking on the 'x' Icon
- Add remote number / SIP
- Enter remote part of the call
- Add by clicking on the '+' Icon
- Remove by clicking on the 'x' Icon
- Date (from - to)
- Enter from Date (optional)
- Enter to Date (optional)
- Evaluation
- 'filter smart calls' hides calls that only represent a part of an already listed entry
- Call state
- 'no answer' - user didn't picked up the call
- 'connected' - user picked up the call
- 'busy' - user was busy at that time
- 'no channel' - user couldn't even reach the other party
- Call direction
- 'incoming'
- 'outgoing'
- Call time (in seconds)
- Enter range for the duration of the call (optional)
- Alert time (in seconds)
- Enter range for the alert duration of the call (optional)
- Add local object
- Table of Content
- Summing Up
- Download
- Available formats: CSV


Example: Call Flow

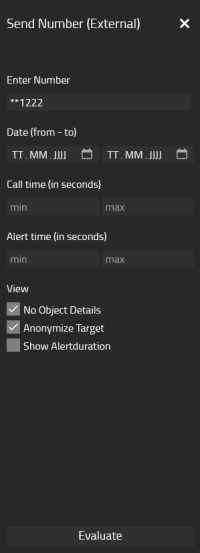
Send Number (External)
Evaluate calls by grouping by an external number. Used for example to bill project numbers. This can be configured by an admin at the user or by the App: Sendnumber - effexx
- Filter
- Enter Number
- Enter external number (optional)
- Date (from - to)
- Enter from Date (optional)
- Enter to Date (optional)
- Call time (in seconds)
- Enter range for the duration of the call (optional)
- Alert time (in seconds)
- Enter range for the alert duration of the call (optional)
- View
- 'No Object Details'
- 'Anonymize Target'
- 'Show Alertduration'
- Enter Number
- Table of Content
- Summing Up
- Download
- Available formats: PDF, CSV
- Automate
- see 'Automated Reports'


Example: Send Number (External)

Waiting Queue (Incoming)
Has the same range of functions like 'Send Number (External)', but instead of grouping by an external number, you can group by a waiting queue. If a call for example comes in through a trunk, connects to a waiting queue and then gets forwarded to a user, this wouldn't be considered as one call, but as a flow of calls. Thats Problematic for billing, so 'Waiting Queue (Incoming)' simplifies this by merging it into one call and displaying the actual caller and acceptor of the call through a waiting queue.
Example: Waiting Queue (Incoming)

Waiting Queue (Employees)
Like 'Waiting Queue (Incoming)' the calls are grouped by a waiting queue and by the users in that waiting queue. Instead of a list of calls 'Waiting Queue (Employees)' will display all users in that waiting queue and also the call count, the call duration, the alert duration and the ⌀ call curation, the ⌀ alert duration.
Example: Waiting Queue (Employees)

Automated Reports
Auotmated Reports can be created by clicking on the 'Automate' Button in 'Send Number (External)', 'Waiting Queue (Incoming)' and 'Waiting Queue (Employees)'. The current config for evaluating will be attached to the automated report except the date. Auotmated Reports will create PDFs in a given rythm. These PDFs will be in the Archive.
- Automated Report
- name (optional)
- description (optional)
- rythm
- email notification (optional)
Admin App
![]()
Configuration
Set the pbx (ideally the master). This pbx will be used for replicating users and getting details about licenses. If not set, the first connected pbx will be used. The Pbx name can be found at: Devices App > Devices > 'Pick the PBX' > Admin Ui > PBX > Config > GENERAL > PBX Name. Alternative at Users Admin > Hamburgermenu > PBX Name.
E-mail Server
Needs to be set, if the user wants to receive E-Mail Notifications. In most cases is 'Sender E-Mail' equal to 'Username'. The 'Host' is normally localhost. For the 'Sender Displayname' we recommend 'Analytics App'. To test the sevice you can send a Test Mail.
Export
Will export the cdrs database as a csv.
About the App
Build version.
Licensing
Licensing: innovaphone licensing, how many licenses are needed is listed here.
The Number of licenses has to be filled in the licenses input field of the Analytics admin pbx app object. Also only at the Analytics admin pbx app object should be activated the checkboxes like in the next screenshot, no active checkbox in the Analytics user pbx app object!

Prerequisites
You have a free cdr record in the pbx you could configure. You could configure two in the pbx ui and more in through the pbx console/ config file.
Versions
The first app version starts with a free beta phase, but a free license key is needed.
Compatible innovaphone firmware versions
- MediaRunway Analytics 1.0 (133xxx)
- innovaphone V13r3, V14r1
Application versions used for interop testing
- MediaRunway Analytics 1.0 (133xxx)
- innovaphone IPVA V13r3 sr8
Configuration
CDRs
To collect Data about calls, the CDRs interface needs to be configured. Navigate to Devices App > Devices > 'Pick the PBX to get the CDRs from' > Admin Ui > Gateway > CDR1. The default configuration from CDR0 can be copied. Important is that the path needs to end with 'analytics/cdr'. One way to test the configuration is to do a test call and export the CDRs database in the Analytics Admin App. If its not empty, its very likely that its configured correctly.

- the 'Adress' is the uri (without https) of the app platform.
- the 'Path' for CDR is the same uri (also without https) which is shown in the 'AP Manager' app at the app instance under 'Webserver path'
Installation
After installing the app, adding the app instance and the app object for the users and the admin, someone can start using "Analytics". The steps of the installation process are the same as described in this article "Callback - Install App from App Store" only with different names.
Brief summary of the installation
- Install the app from app store
- Create an instance of the app
- Values needed: Name ("Analytics", no blanks here please) - Domain (your platform domain) - App Password (generate one, 15 characters) - DB Password (generate one, 15 characters) - other values will be filled up automatically
- Add the user and the admin object with PbxManager app (when selecting the name, please do not use spaces.)
- Configuration and licensing
The following is an installation example.
AP manager settings

PBX manager settings
You have to create the user and admin object.

Copyright information
Contact
| MediaRunway GmbH & Co. KG |
| Venloer Str. 8 |
| D-41569 Rommerskirchen |
| Tel: +49 2183 80628-0 |
| Mail: myApps-sales@mediarunway.com |
| Support: myApps-support@mediarunway.com |
| Website: MediaRunway.com |
For any questions please refer to our contact page.