Reference:Device Health Check
Applies To
This information applies to
- all innovaphone gateways
More Information
If an innovaphone device traps(unwanted re-start) you have different possibilities for debugging. Also if the systems malfunctions without trapping (e.g lost or rejected calls, bad voice quality, etc.) the following working procedure might help finding the problem.
Problem Details
- In case that the device trapped, you should get a trace file from the device. The trace can be obtained by clicking on trace(buffer) in the Administration/Diagnostics/Tracing menu.
Writing to the trace buffer is disabled when the device traps. Also, the trace buffer is not cleared on a re-start. Thus, after a re-start, you can obtain the trace from before the re-start, showing the trap situation! This trace will contain the reason for the restart.
- Inspect the Administration/Diagnostics/Events. Look through the list for events that might cause the unexpected behaviour.
- Have a look at the Administration/Diagnostics/Counters menu. The counters show the current usage of different components. Also a view of their previous usage (up to 12 hours in the past) is possible.
- CPU - shows the CPU load over time. Use the scroll function and look for unexpected high CPU load.
- MEM - shows memory usage. In a running system the memory usage should stay constant. A linear increase of memory usage over time shows a memory leak.
- TEL/PRI/BRI - shows the usage of B - channels on the interface.
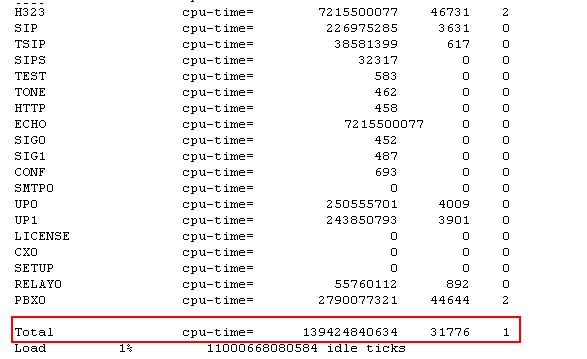
- use the mod command, e.g. http://172.16.3.63/!mod. This will give you such an output:
Using the Total CPU time you can calculate the CPU usage of each module and look for possible problems. E.g. the HTTP module has the highest usage, you might want to look for problems related to SOAP (HTTP), Webmedia (HTTP) etc.
- use the mem command, e.g. http://172.16.3.63/!mem. This will give an output that shows the memory usage of each module.
